WHAT IT MEASURES
An underwater glider measures different things in the seawater: some are physical (the amount of salt, the temperature) and others are biochemical (the amount of oxygen or chlorophyll in the water).
Physical parameters:
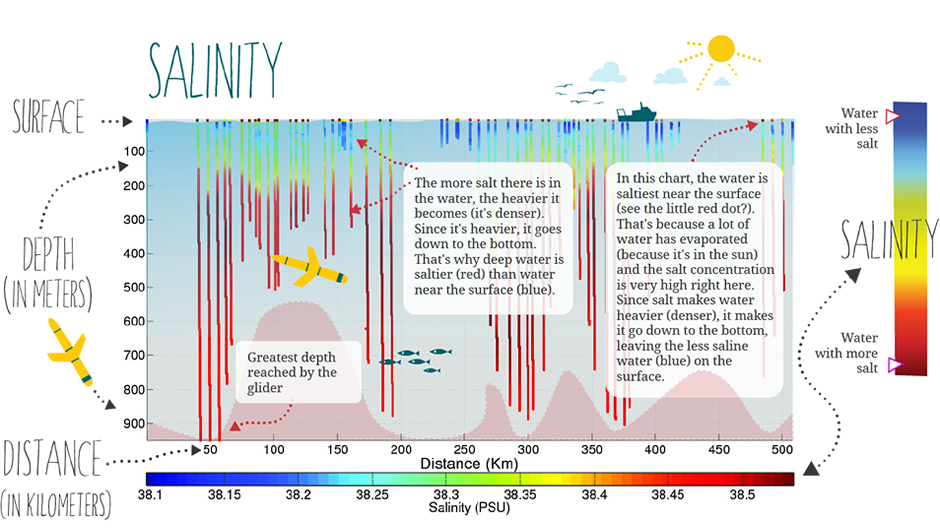
salt and temperature Do you think the amount of salt in the water is the same everywhere in the sea? And that the temperature is the same, too? Well, it isn't! The water that flows into the Mediterranean from the Atlantic Ocean through the straits of Gibraltar contains less salt. Meanwhile, the water in the eastern Mediterranean is saltier. Why do you think it is? In the eastern Mediterranean, there's more evaporation, and if more water evaporates, the proportion of salt left in the water is higher.
salt and temperature Do you think the amount of salt in the water is the same everywhere in the sea? And that the temperature is the same, too? Well, it isn't! The water that flows into the Mediterranean from the Atlantic Ocean through the straits of Gibraltar contains less salt. Meanwhile, the water in the eastern Mediterranean is saltier. Why do you think it is? In the eastern Mediterranean, there's more evaporation, and if more water evaporates, the proportion of salt left in the water is higher.
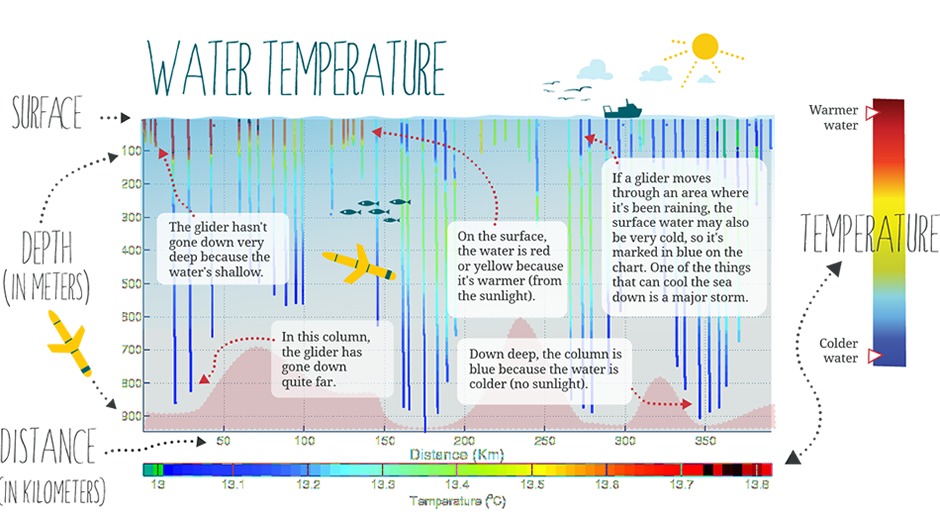
And why would we want to know about the water's temperature and salt content?
Seawater is not the same on the surface and down deep. On the surface, it's not very dense. Density depends on salt and temperature, among other things. So when we measure its temperature and salinity, we find out about the changes in the water's density. These changes affect marine currents: if we have that information, we can find out more about how currents move. We can also find out more about the weather's influence on the sea. For example, if it rains, the surface water cools down. If the weather's very hot, the surface water warms up. That also has an effect on marine currents.
Biochemical parameters:
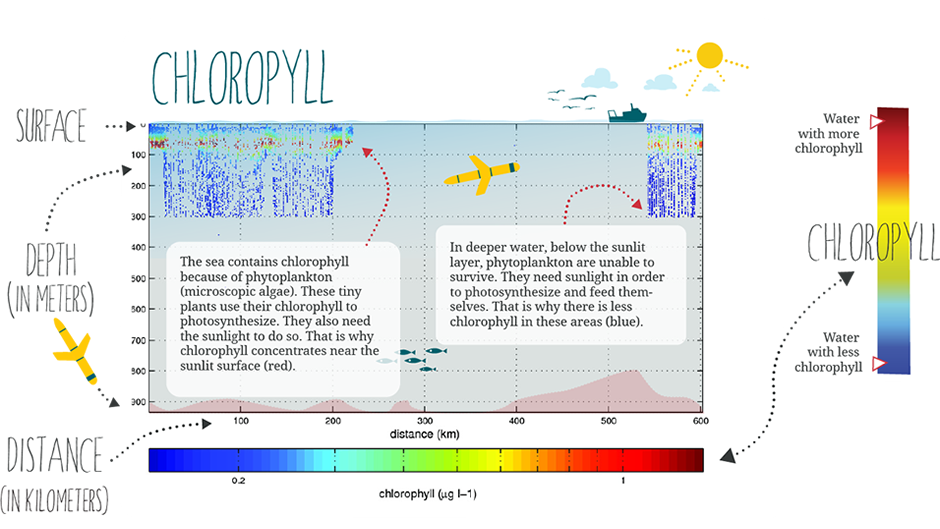
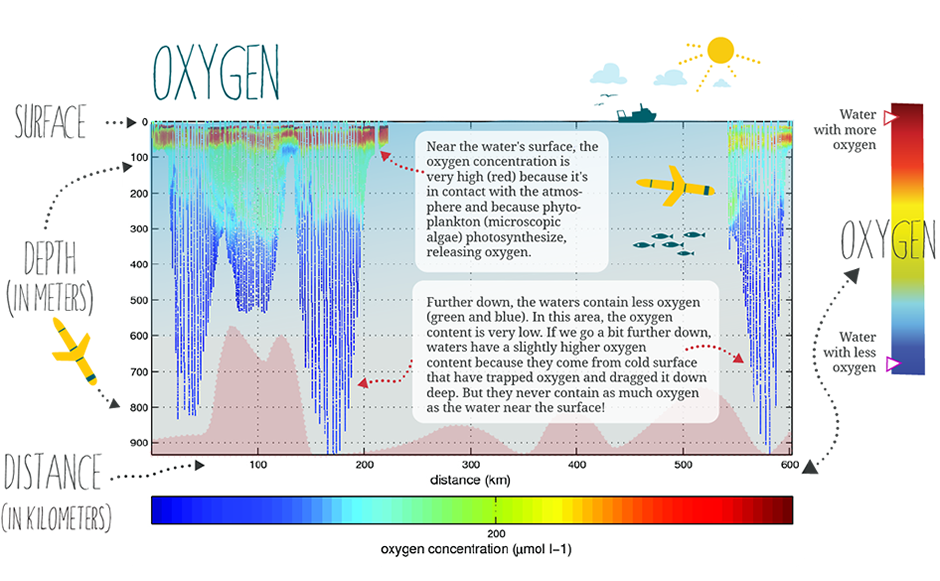
oxygen and chlorophyll The oxygen and chlorophyll in seawater are very important for marine ecosystems. Oxygen is what most animals and plants need to survive. And chlorophyll helps us know how much phytoplankton the water contains. Phytoplankton is made up of small organisms (like tiny algae) that photosynthesize and have chlorophyll. So, if there's a lot of chlorophyll in the water, it means there's lots of phytoplankton. Do you think that's important? It sure is, because many marine animals feed on phytoplankton! Phytoplankton also absorb large amounts of CO2; they're like a forest in the sea, the "ocean's lungs."
oxygen and chlorophyll The oxygen and chlorophyll in seawater are very important for marine ecosystems. Oxygen is what most animals and plants need to survive. And chlorophyll helps us know how much phytoplankton the water contains. Phytoplankton is made up of small organisms (like tiny algae) that photosynthesize and have chlorophyll. So, if there's a lot of chlorophyll in the water, it means there's lots of phytoplankton. Do you think that's important? It sure is, because many marine animals feed on phytoplankton! Phytoplankton also absorb large amounts of CO2; they're like a forest in the sea, the "ocean's lungs."